Monit: Urban Development wit Parking Data

Traditionally municipalities based their parking policies on rather limited data: parking occupancy measurements and educated guesswork. Nowadays, parking data is obtained through various means, including scan cars, providing much more accurate data. Additionally, this data is available any time.
Historically the development of parking policies relied almost exclusively on parking occupancy measurements, often made as a snapshot in time. Policy was then created using this data for several years. Trends over time, such as seasonal patterns, remained speculative. Today, transaction data from on-street and off-street parking, as well as data from scan cars, is almost continuously available. Monit Data has been transforming this data into relevant and clear information for over 10 years, helping municipalities develop better parking policies for both existing areas and new urban developments.
Visitors parking metric analysis
One example is the so-called visitors parking metric, where a standard of 0,3 parking spaces per household was often applied. Based on parking data from more than 15 municipalities collected by Monit Data, a recent analysis revealed the actual usage. Usage rarely exceeded 0,15 spaces per household, indicating that half the number of parking spaces could suffice.

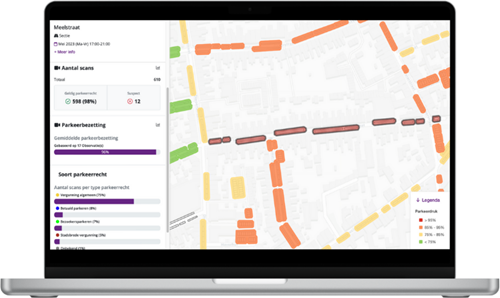
Dashboard of parking occupancy measurement with the scan car.
Parking balance in urban development
Another good example is a dynamic parking balance between supply and demand in urban development. The policies of many municipalities allow for the available parking capacity to be (partially) allocated to new developments. The main principle is that parking should be arranged on private property; however, if there is available space on the street in the evenings, for example, that free capacity can be used as part of the parking balance to meet parking demand. Monit Data offers a parking balance model that uses the actual occupancy rate from the past rolling year as its basis. First, the available free parking capacity per area is filled in, for example, on the fifth busiest day of the year in order to get a representative number. Then, the parking spaces to be provided on private property are added. This quickly shows whether the total supply (private spaces plus available public spaces) of parking capacity is sufficient for demand, providing quick insights into parking issues in area development.
Meet Monit at the Nationale Verkeer Expo for more information
Our team is ready to tell you more about how to improve urban development and parking policies with the use of parking data. Visit us at booth 6.14 at the National Traffic Expo in Houten in The Netherlands on 28 November 2024. Click this link (Dutch only) for more information and to register for free admission to the expo.
This article was created in collaboration with the publication MobiliteitsPlatform. The original publication can be found via this link (Dutch only).
About Monit Data
.png) Monit Data provides parking data analytics services for municipalities and private operators. User-friendly dashboards give clear information on car, EV, and bicycle usage. Use data-driven insights for urban mobility policies and day-to-day operational management.
Monit Data provides parking data analytics services for municipalities and private operators. User-friendly dashboards give clear information on car, EV, and bicycle usage. Use data-driven insights for urban mobility policies and day-to-day operational management.


Comments
There are no comments yet for this item
Join the discussion